
NASIG Autumn 2023 Conference – October 16-18, 2023
Prepared by The 2023 Evaluation & Assessment Committee: Kevin Balster (chair), Rachel Bomberger (vice-chair), Jessica Harris, Martha Hood, Megan Inman, Lisa Martincik, Keri Prelitz, Barbara Pope, Jessica Rigg, Sarah Sutton, Susan Vandagriff
The NASIG Autumn 2023 Conference was the first of its kind – a fully virtual conference that was held in addition to the fully in-person conference in May. The conference took place over three days, and included a Welcome and Vision Session, a Virtual Members’ Forum, several sets of “Short” and “Medium” sessions, two longer-length sessions, 13 pre-recorded presentations, and two hosted sessions for discussing the pre-recorded presentations. Out of 159 registered attendees, 41 (25%) submitted conference survey responses. Notably, The survey technically lists 43 responses, but two people submitted two responses, bringing the number of unique respondents to 41. In both cases, some of the responses were complementary (i.e., they provided feedback to some questions only in one of their responses), so we are including calculations from all 43 responses in our report below. Survey respondents could enter their name for a $50 gift card of their choice. The winner was Lihong Zhu of Washington State University.
Respondent Demographics
As opposed to the in-person conference survey, a slight majority of respondents were not NASIG members (58% or 25 respondents). However, as with the in-person conference survey, the majority were academic library employees (76% or 33 respondents), and have at least 11 years of experience (67% or 29 respondents).
Respondents were asked to “describe your work,” using keyword checkboxes (including “other”). They could check more than one answer. The top five responses were:
- Electronic Resources (62%)
- Acquisitions (44%)
- Catalog/Metadata (37%)
- Collection Development (37%)
- Serials (30%)
Respondents were also asked to select the number of NASIG conferences they have previously attended, with the majority having attended five or fewer conferences (76% or 33 respondents).
Notably, the only major difference in respondent demographics between the in-person and virtual conference is the number of non-members responding to the survey.
Overall Conference Experience
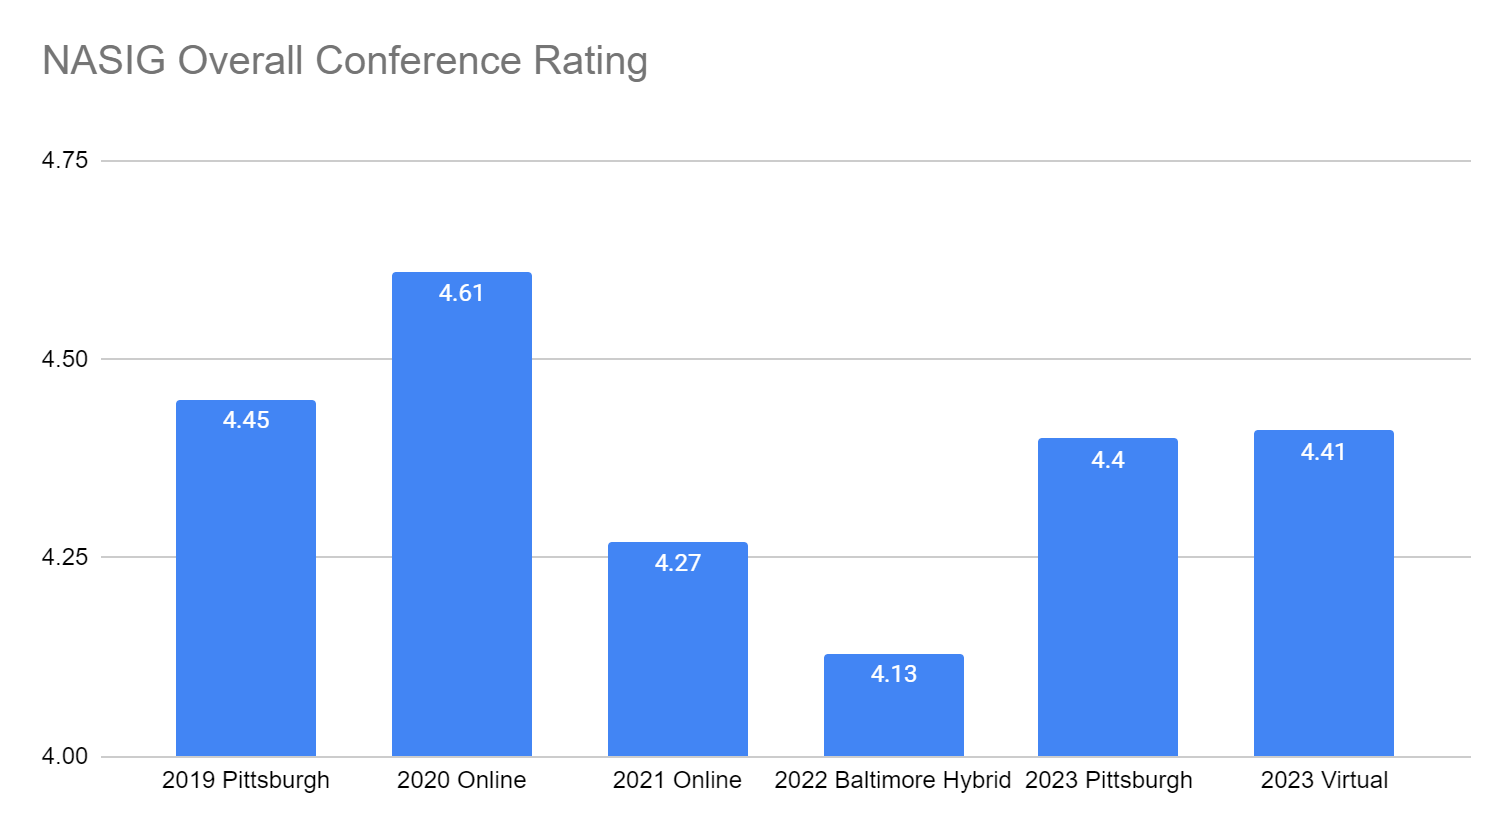
The overall conference rating was 4.41, which is roughly in line with recent fully virtual or in-person conferences.
The rating for the balance of sessions was 4.37, which is an increase from the prior three conferences.
The ease of using Sched was rated at 4.44.
When asked if they could change one aspect of the conference, 29 respondents offered suggestions. There were no major themes, but the topics that were mentioned more than once included price (6 respondents), time of year (4 respondents), closed captioning for pre-recorded sessions (3 respondents), timeliness of the conference announcement and registration (3 respondents).
Of the 43 responses for the question about institutional support, 60% (or 26 respondents) answered that their institution supports both in-person and virtual attendance. There were several “Other” responses that indicated respondents may receive support for any type of attendance, but that funds were very limited, so combined with the 16% (or 7 respondents) who only get virtual support and 11% (or 5 respondents) who don’t get any support, a less expensive virtual option was welcome.
Welcome and Vision Session, Members’ Forum, and Wrap Up
NASIG Autumn 2023 included three sessions distinct from the regular programming: a Welcome and Vision Session, the Virtual Members’ Forum, and a Wrap Up Session. There were 38 responses to the Welcome and Vision Session, which had an overall rating of 4.02. There were six comments for the session, so it is difficult to extract significant themes, but views were mixed concerning the purpose and focus of the Vision Session. 22 respondents provided feedback on the Virtual Members’ Forum, which had an overall rating of 4.26. And finally, there were 25 responses for the Wrap Up session, with an overall rating of 4.36. There were only five comments, but there are two themes that appeared in comments from other sections, so we are providing them. First, there were several comments about the desire for recordings of the live sessions, and for slides to be available promptly for both the live and pre-recorded sessions. Recordings of the live sessions were made available a few weeks after the conference, so there may have just been some miscommunication. Second, there were several positive comments about Courtney’s officiating of the conference.
Live Sessions
The majority of the sixteen live sessions of the conference were grouped into two different categories based on length – six “short” presentations held over two sessions, and eight “medium” presentations held over four sessions. There were also two longer-length sessions held separately. Given the discrepancy in length, any direct comparisons between presentations of different lengths may be difficult to make – what works as a short presentation may not work as a longer presentation, etc. However, given the overall number of presentations, our analysis will include the highest ranked sessions from across every length grouping. The five highest rated sessions were “Adding ISO 639-3 Language Codes to MARC Records Using OpenRefine Wikidata Reconciliation” (4.29 rating with 24 responses), “Where to Get Started with E-Resources: A Compilation of Resources for Beginners New to Electronic Resource Management” (4.29 rating with 31 responses), “Applying Deselection Strategies to Ebooks” (4.19 rating with 31 responses), “TAAPing In? Effects of an Equitable Access Textbook Program on Library Collections and Services” (4.13 rating with 30 responses), and “Artificial Intelligence History, and Libraries: History and Legacy of Library Contributions to Machine Learning” (4.125 rating with 32 responses). Of the 16 sessions, 7 received ratings of 4 or higher. Six of those were for “medium” presentations, and one was for a “short” presentation.
While most sessions received fewer than three comments, one relatively common theme was the positive views towards real-time demonstrations of tools or processes. Including sessions with real-time demonstrations or walk-throughs in future programming for virtual conferences may be a helpful way to engage with conference participants.
Pre-Recorded Sessions and Discussion Sessions
The most unique aspect of the conference was both the collection of pre-recorded presentations, and the two Discussion Sessions held to discuss the pre-recorded presentations. Both Discussion Sessions received 19 responses. The Tuesday session had an overall rating of 3.89, while the Wednesday session had an overall rating of 3.94. Comments were mixed, with some participants enjoying the concept, while others wished that there was more structure or understanding of how the sessions would work ahead of time.
Out of 43 responses, a slight majority (51% or 22 respondents) indicated that they had not viewed the pre-recorded sessions. Survey respondents were not able to edit their responses after initially submitting the survey, so we cannot know for certain how many respondents viewed any sessions afterwards. This presents an opportunity for E&A for future surveys, since we may be able to allow respondents to revise their responses in order to add ratings for pre-recorded sessions. However, it is difficult to know if this would result in more robust response numbers, and/or cause unforeseen consequences to the survey results.
Response rates for the pre-recorded sessions ranged from four to 17, so it may not be possible to extract meaningful data in order to determine the highest rated sessions and topics of interest for future sessions. Two sessions received at least 10 responses, and both received very positive reviews – “AI as a License Review Assistant” (4.47 rating with 17 responses) and “Open Access in a Library Discovery Tool” (4.58 rating with 12 responses).
Future Conferences
The survey requested that respondents rate their likelihood to attend the 2024 NASIG In-Person Conference or a future Virtual Conference on a Likert scale of one to five with one indicating not at all likely and five indicating very likely. Of the 43 responses, a slight majority (53% or 23 respondents) indicated that they were not likely or not at all likely to attend the in-person conference, but an overwhelming majority (86% or 37 respondents) answered that they would be likely or very likely to attend a future virtual conference. When asked to provide a reason why they are not likely to attend the in-person conference, nearly every response cited either funding issues or other problems with traveling.
Given the ongoing concerns around travel and institutional support, there appears to be interest and support for holding future virtual conferences.
The survey requested responses on what future topics attendees are most interested in based on a Likert scale of one to five with five being the highest. The top five rated topics from 76 respondents include:
- Issues related to electronic serials (4.36)
- Technology (4.22)
- Acquisitions (4.11)
- Diversity, Equity & Inclusion (4.00)
- Accessibility (3.97)
If you have any further questions or comments, please reach out to the Evaluation & Assessment Committe at evaluation@nasig.org


